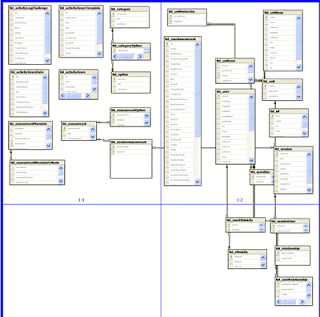
This might seem like an OBVIOUS statement but believe it or not, I recently forgot how in the world I got this nice little printed out diagram of my database which hangs near my desk! (so sad)
Under your database, there will be a folder named 'Database Diagrams' - you can right click on this folder and add a new diagram. This is nice because you can arrange the tables of your database just how you like them (expanding or contracting) -- change the size, etc.
For me, I made my own diagram...enlarged so that it fit on four pages of paper. I printed off the those pages then was able to go to a larger printer and print a larger poster style (we have a very large database) .
Again, this was extremely handy because I am a visual learner and I absolutely needed this diagram to understand how our data related.


No comments:
Post a Comment